Tired of wrestling with quantifiable data? Easy Graph simplifies data tracking and management, making it effortless to monitor metrics like electricity usage. This user-friendly application streamlines the process, allowing for easy daily data entry and presenting clear visualizations, such as value graphs and growth line charts. Further analysis is simplified by the ability to export datasets as text files for offline processing.
Easy Graph's Key Features:
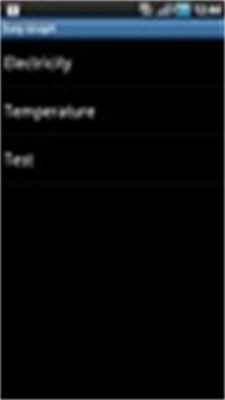
- Simplified Data Management: Effortlessly track and manage numerous data sets with a focus on ease of use. Ideal for monitoring various metrics.
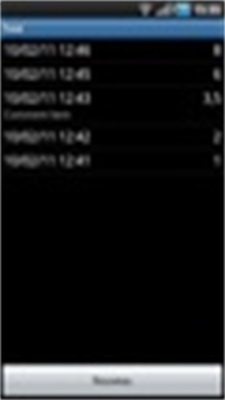
- Intuitive Data Input: Enjoy a smooth, user-friendly interface for convenient daily data entry.
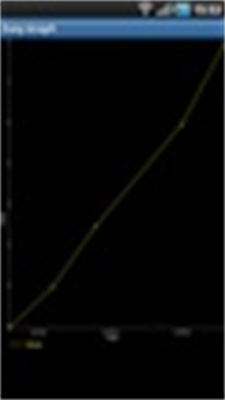
- Visual Data Insights: Gain clear understanding of trends and progress through visually appealing value graphs and growth charts.
- Data Export Capability: Export your data as text files for detailed analysis using your preferred desktop applications.
- User-Friendly Interface: Navigate data management with an intuitive graphical display designed for efficiency and accessibility.
Permissions: The app requires internet access (primarily for ad support) and permission to write to external storage to enable data export. These are necessary for optimal functionality.
In Conclusion:
Easy Graph provides a hassle-free approach to data monitoring and visualization. Whether for personal or professional use, its intuitive design and powerful features empower users to easily track, analyze, and understand their quantifiable data. Download Easy Graph today and experience the difference!